Deprecated: Creation of dynamic property WDS::$front_url is deprecated in /home2/ppcteoti/public_html/wp-content/plugins/slider-wd/slider-wd.php on line 113

Deprecated: Creation of dynamic property WDS::$site_url_placeholder is deprecated in /home2/ppcteoti/public_html/wp-content/plugins/slider-wd/slider-wd.php on line 89

Deprecated: Creation of dynamic property WDS::$site_url_buttons_placeholder is deprecated in /home2/ppcteoti/public_html/wp-content/plugins/slider-wd/slider-wd.php on line 90

Warning: Constant automattic\jetpack\extensions\social_previews\FEATURE_NAME already defined in /home2/ppcteoti/public_html/wp-content/plugins/jetpack/extensions/blocks/social-previews/social-previews.php on line 14
Project publications Archives - Plaza of the Columns Complex

Browsed by
Category: Project publications

Drawings

Drawings

How to Draw: Archaeology Version

by Yolanda Peláez Castellanos

Part 1: The Field

Archaeologists are responsible for recording everything that they find as the materials could provide valuable research information not only about the context but also about past human activities. Once the materials are completely registered, they are removed from their original context. For that reason, it is essential to record as much information as possible out in the field. Field drawings are part of this registering process, and that includes having the context drawn by hand, capturing the ‘what’ and ‘how’ the archaeologist encountered the excavation area.

Profile drawings

Have you ever driven through a mountainous landscape and observed the different shades of sediment peeking out of the exposed mountain rock?

Mountainous landscape (photo taken from https://www.pngegg.com/en/png-boaxc).

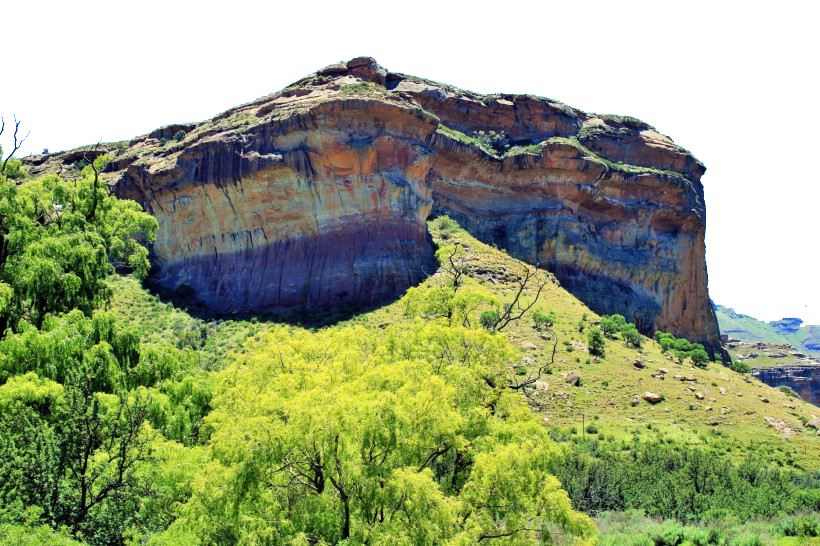
Well, back to archaeology. Think of the term “profile” as the excavation unit’s “walls.” The rock or layered sediments you see actually resemble an excavation profile. Profile drawings are important for understanding the pit’s history as different periods of time are captured by the various colors of sediments and their composition. When you combine this information with architectural and human modifications of the landscape, they can help us to understand if a structure collapsed, whether it was an intrusion or looting activity, as well as where architectonic elements (floors, walls, canals) were spatially and chronologically located. Visit the Excavations section to read more about stratigraphy.

Profile drawing example (Drawing by Amparo Robles).

Why are drawings even necessary? Can’t archaeologists just take photos?

Drawings and photographs complement each other when studying an area. Although photographs do capture color, they are taken at certain angles, limiting what is taken within each frame. On the other hand, profile drawings are accurate and do not distort what is being recorded; the drawings are drawn precisely and to scale. Additionally, sometimes there are profile details that can be better appreciated in person but are not clear in photos.

Plan drawings

These drawings show the excavation unit from above, a bird’s eye view. They depict the distribution of different architectonic elements and their relationship with each other.

Example of a plan drawing (Drawing by Amparo Robles).

Special contexts

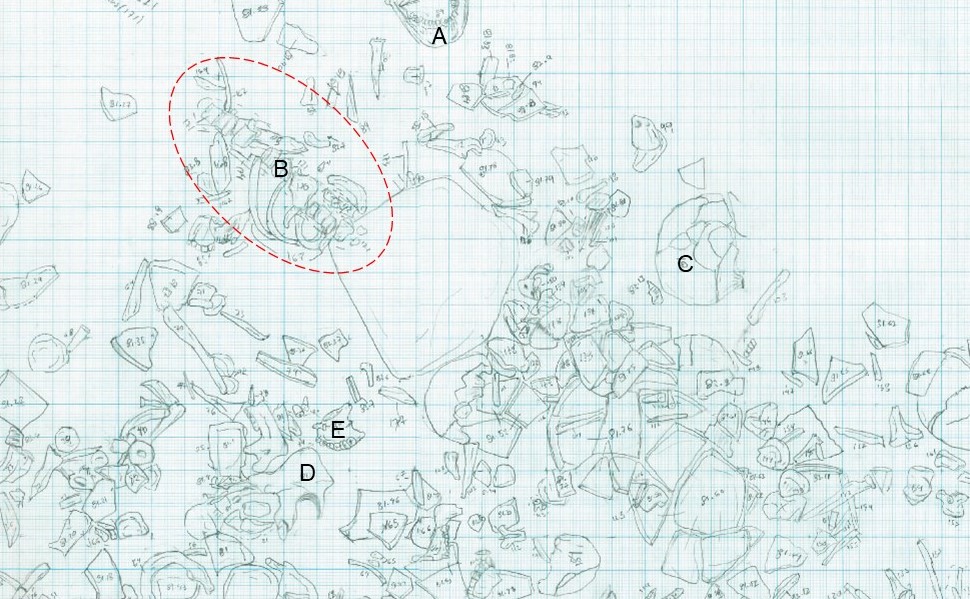
Special contexts that show evidence of human activities, like burials, trash pits, and offerings, are also recorded as detailed plan drawings. In these cases, the exact location and thus distribution of each artifact is drawn and assigned a unique number before its removal from the excavation area. The following image is the drawing of a context excavated in Front A (see Results 2018-2019) that had thousands of disarticulated (mostly human) bones. Can you identify some of them (A-E)?

Part of the drawing of an archaeological context (Drawing by Ariel Texis).

Part 2: Digitalization

Digitalization is the process in which field drawings are converted from freeform into a digital form that can be processed by a computer. All field drawings are scanned at the end of each field season for two important reasons: to preserve and to refine field drawings (as a digital format) without changing or losing the original copy.

Each field drawing is scanned and digitally traced using illustration software such as Adobe Photoshop, Adobe Illustrator, or Corel Draw. This way, final drawings are clean, clear, and complete with pertinent details.

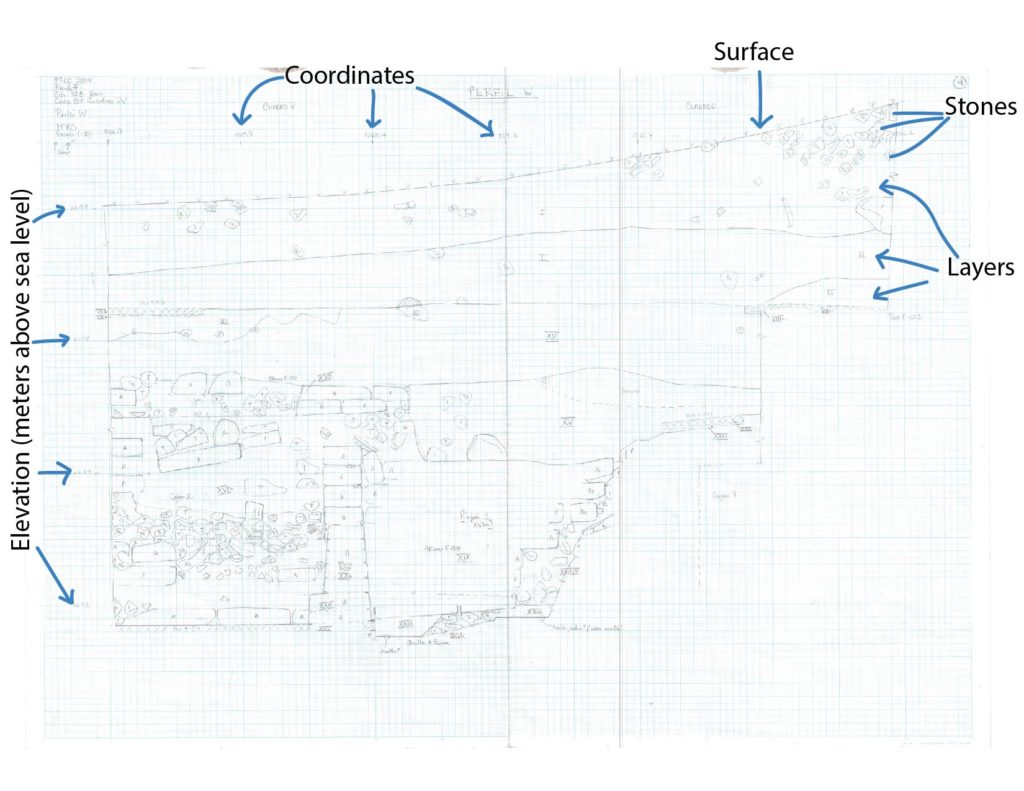
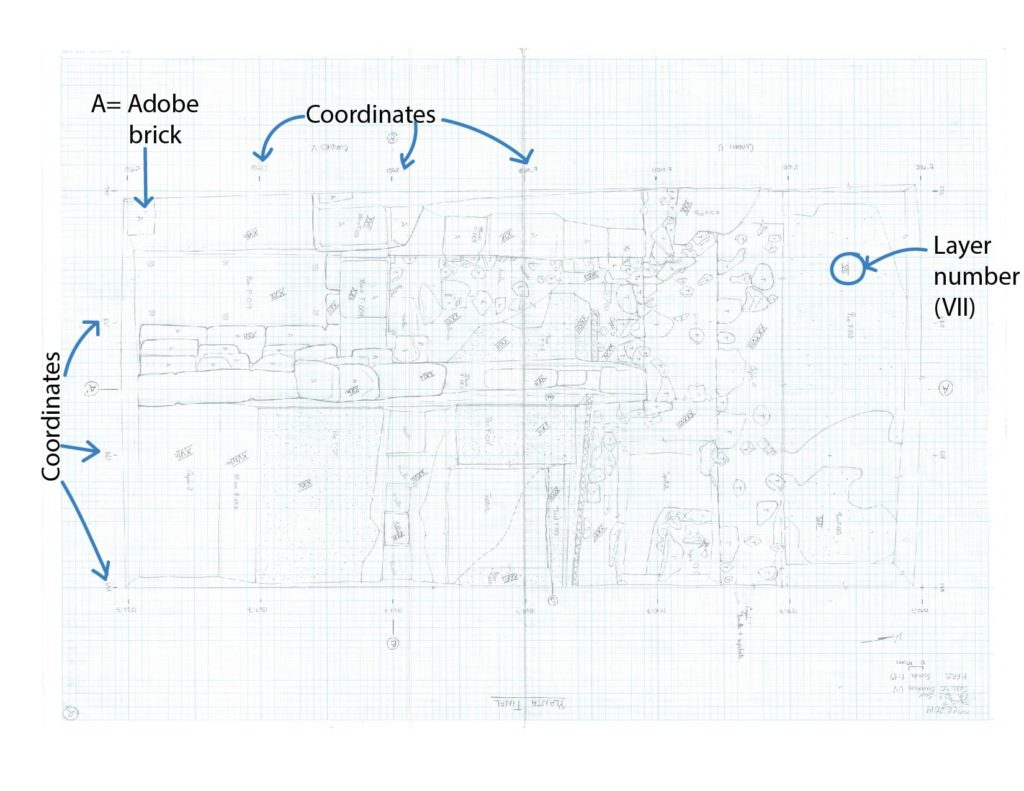
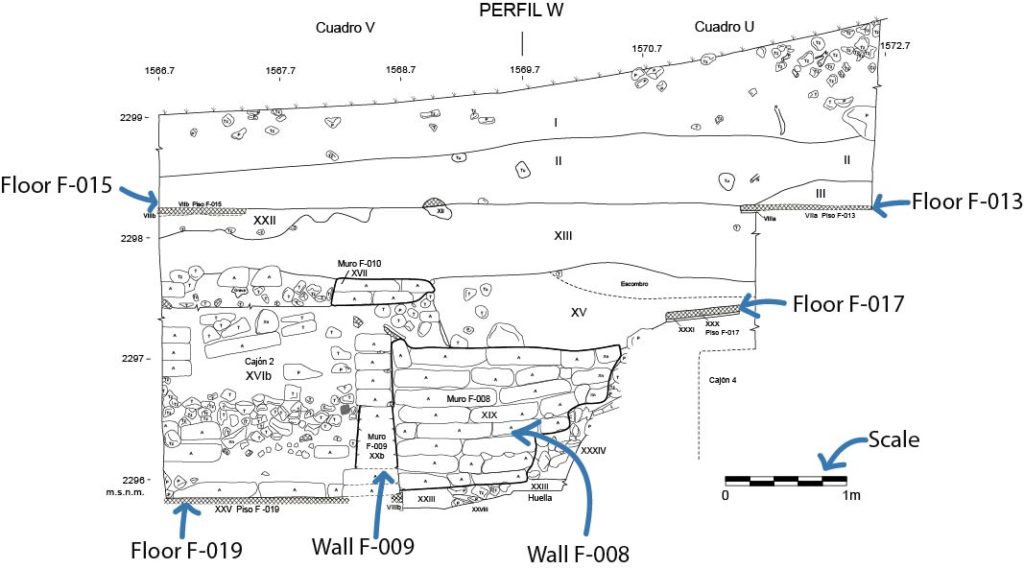
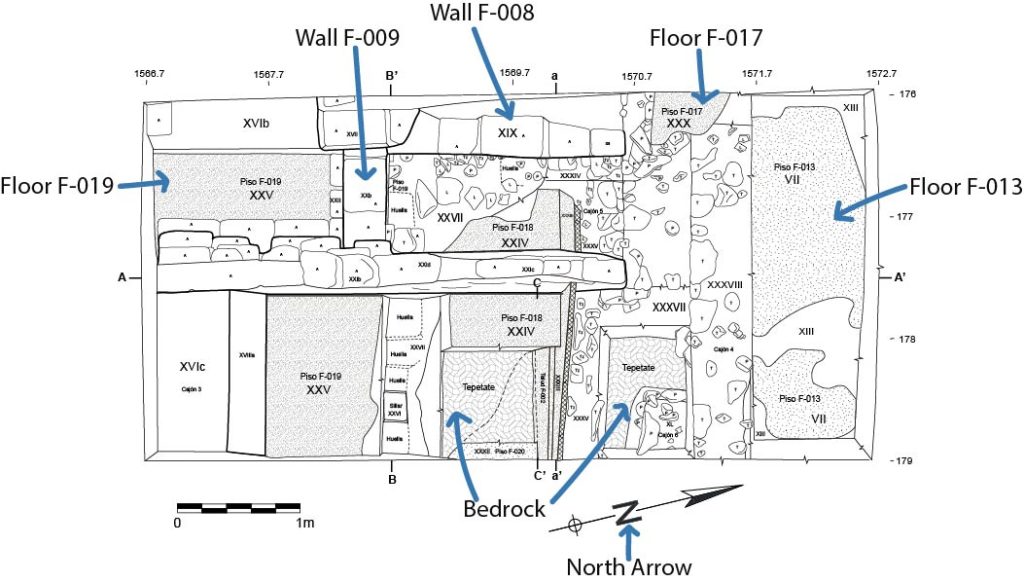
Look at the digitalized profile and plan drawings below. The arrows point to architectural features (i.e., floors, adobe brick walls). Notice that Floor F-015 is missing from the plan drawing. It had to be removed to uncover what was beneath but remained visible in the profile. The vertical (profile drawings) and horizontal (plan drawings) representations show different details, and both are important for understanding the context. If you want to learn more about this excavation area located in the southeastern section of Front F, visit the Results 2018-2019 section. 

Example of a digitized profile drawing (Drawing by Amparo Robles).
Example of a digitized plan drawing (Drawing by Amparo Robles).

Were your guesses on the bones from Front A’s special context correct? Although these materials are still being analyzed, the drawings will be helpful for interpreting the context because they depict the material’s spatial distribution across the excavated area.


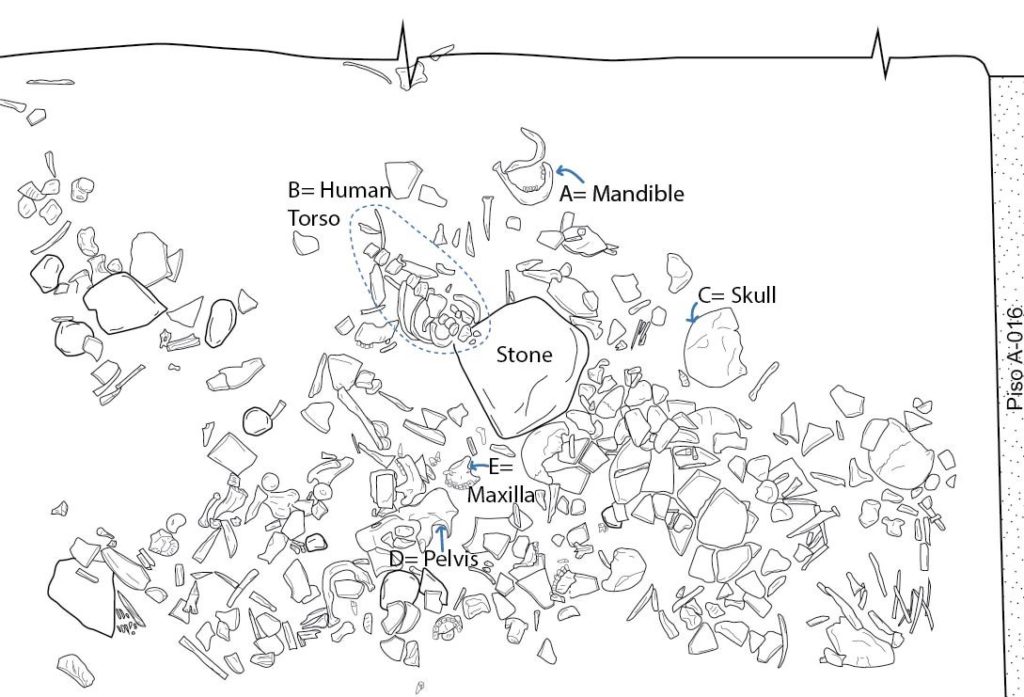
Example of a digitized drawing of a special archaeological context (Drawing by Ariel Texis and Yolanda Peláez).

Part 3: Artifact Drawings in the Lab

Many archaeological materials are recovered in every excavation season, and realistically not all materials are drawn as they can be abundant. While analyzing the artifacts, archaeologists and specialists select those for illustration, usually artifacts that are representative of other excavated material and/or are unique to the context.

The drawing process in the lab is similar to field drawings. Artifacts are first drawn in pencil on a grid paper, allowing for ease of precise measurements and thus to scale. By handling and observing the artifacts in person, the illustrator can capture acute details that may not have been distinguishable through photographs. Afterwards, the drawings are scanned and drawn digitally or traced by hand with ink. 

What kind of information can artifact drawings provide?

A lot! The type of information depends on the artifact, but it is usually related to the object’s manufacture or use:

  • Ceramic is the most abundant material in our excavations, and their drawings demonstrate their various shapes, decorative techniques, and iconographies.
  • Lithic drawings can show the methodical steps in which the raw stone materials themselves were modified, including the decisions made by the artisans themselves (e.g., touchups).
  • Bone drawings depict their anatomy and highlight surface modifications made by humans (e.g., butchery marks, toolmaking).
Example of a candelero drawing (Drawing by Yolanda Peláez).

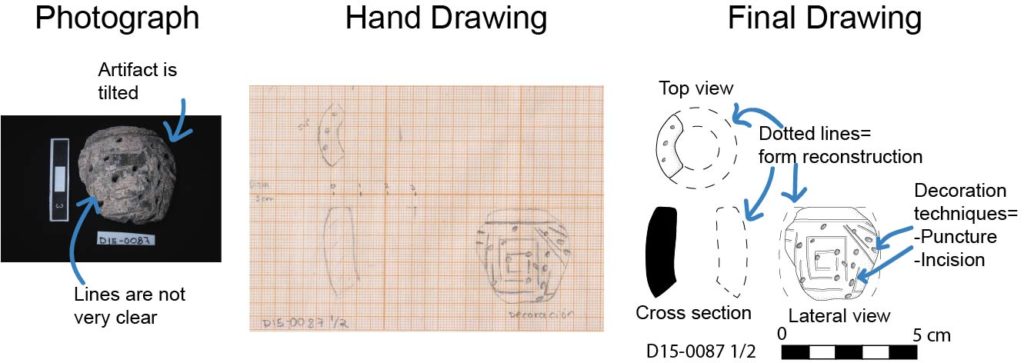
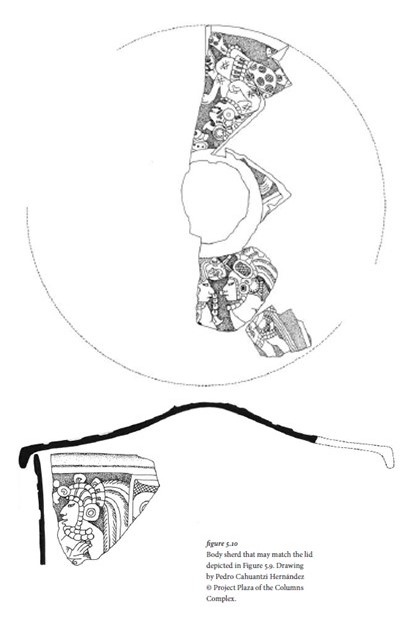
While archaeological artifacts are usually fragmented, certain pieces (e.g., ceramic rims) can be used to reconstruct what the complete vessel might have looked like. Reconstructions are usually delineated by a dotted line.

Ceramic lid of a tripod vessel with plain-relief incisions decorated in the Maya style and body sherd that may match the lid (Drawing by Pedro Cahuantzi Hernández © Project Plaza of the Columns Complex, images taken from Sugiyma et al. 2020:152-153 Figs. 5.9 and 5.10).

Conclusion

Archaeologists meticulously draw the details they see both in the field and in the lab. Since observation is one of the steps of the scientific method, archaeological drawings are essential because they contribute to this research process. Moreover, they are a way of preserving cultural heritage in various forms, not only in a two-dimensional sense but also in a digital format to capture multiple perspectives on a snapshot of history.

References

Pngegg
n.d. Highland Landscape Landform Plain Plateau, Mountain Landscape 2, natural, grass. Electronic document, https://www.pngegg.com/en/png-boaxc, accessed August 18, 2021. 

Sugiyama, Nawa, William L. Fash, Barbara Fash, and Saburo Sugiyama
2020 The Maya at Teotihuacan? New insights into Teotihuacan-Maya interactions from Plaza of the Columns Complex. Teotihuacan: The World Beyond the City, edited by Kenneth Hirth, David Carballo, and Barbara Arroyo, pp.139-171, Dumbarton Oaks Pre-Columbian Symposia and Colloquia series, Dumbarton Oaks Reserch Library and Collection, Washington, D.C.


Flotation

Flotation

Analytical science: straight from the ground and to the laboratory

Soil samples saved from the field are analyzed in the laboratory in order to recover plant and seed remains. The procedure for separating those tiny organic remains from the soil is called “flotation,” that is, where dried soil is gently sieved through a wire mesh with the help of some water. With this method, organic vegetable remains (including ancient ones that are usually carbonized or charred) float up to the water’s surface (light fraction) while the remaining material sinks to the bottom of the container (heavy fraction).

Flotation and fractions.

While the light fraction is analyzed by the paleoethnobotanist to identify the remains of ancient plants and seeds, the heavy fraction is analyzed by trained technicians who recover assorted tiny fragments of ceramic, obsidian, flint, slate, green stone, pyrite, mica, pigment, bone, shell, eggshell, among others. Each type of material is then placed in its own labeled bag with its data recorded.

Heavy fraction analysis.

Although material recovered from the heavy fraction may appear less significant, the study of bone, for example, offer a different picture with the introduction and identification of several animal species, some even needing the help of a microscope. Due to their size, these tiny bones would have otherwise been impossible to find during excavation. Such is the case with the discovery of sea urchin, fish, reptiles, ducks and small birds like hummingbirds and quail. Fauna diversity like these have been very revealing for the study of animals that were used and consumed by the ancient inhabitants of Teotihuacan.

Ancient urban alignment leads LiDAR investigation to new site

Ancient urban alignment leads LiDAR investigation to new site

By Alexis Bridges, Tanya Catignani y Ariel Texis Muñoz

At Teotihuacan the use of detailed satellite imagery and LiDAR technology has allowed for remote detection of archaeological features which are often impossible to see at ground level. It affirms that we can neither escape the legacy of the past nor the influences that it has on our present.

One of the goals of the Project Plaza of the Columns Complex this season has been to determine how much of the present-day Teotihuacan Valley was influenced by the ancient alignment of 15 degrees east of true north. Our team tracked this alignment by digitizing modern features in ArcGIS Online (Figure 1). Because the Avenue of the Dead is so central to the city, it seemed logical that nearby modern structures would be aligned in the same configuration, and areas farther away from the city center would less likely display this pattern. Our results abiding by the strictest of calculations revealed that more than 30% of the region does match this traditional alignment, even areas that are far away from the city center. One theory for this is that ancient structures, long crumbled and buried over the centuries since their initial construction, may have  influenced contemporary building and agricultural decisions by raising complications of digging and plowing around these archaeological features.

Figure 1: Satellite map of the Teotihuacan Valley with digitized modern features. Site TC-8 is located at the center-left.

One town in particular that drew our attention lies to the west of the city center (see Figure 1). Nearly all of the town is aligned, resulting in a massive hotspot of digitized features on the map. However, the LiDAR and satellite maps did not reveal any obvious archaeological features in the area. After studying old archaeological reports, we found that this location had, indeed, been previously excavated. In the 1960s William T. Sanders discovered an apartment compound capable of housing hundreds of people at its peak occupation and was inhabited at least until the Colonial period (Figure 2). Although Sanders’ team identified this site as TC-8, the eighth site associated with the Teotihuacan Classic period, his site map lacked identifiable features that could have led us to the excavation site.

Figure 2: Site drawing of TC-8 by Sanders team (The Teotihuacan Valley Project).

Despite this, Sanders created a second map that charted the entire valley, fortunately safeguarding sites that may have disappeared over time. A rough location of the site was found by georeferencing what streets and towns still existed. From there, a rock alignment could be seen on the LiDAR map as well as very, very slight mound formations that closely matched with the ones identified on Sanders’ map (Figure 3).

Figure 3: LiDAR digital elevation map (DEM) showing the mounds at TC-8.

Preliminary ground truthing has yielded promising results of pottery sherds and shell fragments  ̶  an unusual find for an inland area. Using a similar process, another site in the southwest known as TC-21 was also located with similar finds of ceramic sherds. Although these preliminary results are not confirmation, they do indicate that our locations may be these previously forgotten Sanders’ sites.            

This experience highlights the power of combining modern technology with historic data. Technology without the analog aspects of archaeology cannot show us everything, and relying entirely on technology will create a loss of data. The re-discovery of TC-8 and TC-21 only shows that archaeology is, and will likely remain, a historical science at its foundation.

LiDAR

LiDAR

LiDAR technology (Light Detection and Ranging/ Laser Imaging Detection and Ranging), is a remote sensing method that uses a device that measures different surfaces of the earth, to analyze various forms of geographical structures and architectural structures. Emitting a laser that measures and records the distance between the emitting device and the object that reflects the emission, LiDAR technology creates three-dimensional information about the shapes and surfaces from scanning the cultural and natural features. The device works as an airborne scanner, firing thousands of laser emissions per second and recording “returns” to the device; creating a “point cloud” that allows for the analysis of the data points and is also geographically referenced.

Avenue of the Dead and Moon Pyramid: LiDAR point cloud.

The data points obtained from LiDAR technology create a three-dimensional model of the earth’s surface but also the various man made and natural features that cover the land that it hovers over: including but not limited to viewing  density of vegetation, agricultural features, ancient structures, modern structures, and land use. One of the great advantages of this technique is that the data processing makes it possible to “eliminate” the vegetation layers (virtually) that covers the land and to obtain a detailed “portrait” of the land surface, creating a Digital Elevation Model (DEM). A Digital Elevation Model (DEM) is a three-dimensional model of the surface that is formed from the elevation data, obtained by LiDAR technology in this case. The degree of detail that these types of digital maps and images have is greater than that which could be obtained by traditional surveying, in addition to saving a lot of time and work force. LiDAR was first used by scientists and mapping professionals, but now a days has been incorporated into the research of other disciplines as well.

Sun Pyramid: aerial photograph (left) merged with DEM image (right).

Recently, LiDAR technology  has been incorporated into archaeological research complementing traditional methods of surveying lands such as aerial photography and simply walking/recording sites manually. The LiDAR data is referenced to the Global Positioning System (GPS) that collected data and information can be geographically referenced. Technological advancement has allowed for high resolution images to be created and has reduced degrees of error, that now the registration of the features or elements detected on the LiDAR map are calculated in centimeters.

At the Teotihuacan Valley, the Project Plaza of the Columns Complex generated a LiDAR map in 2015. The map covers an area of ​​approximately 165 km2. The local vegetation does not interfere with the surface of the investigated area, instead modern structures (urban areas) dominate the valley today covering ancient remains.  Instead of working through vegetation, the challenge is to know what is ancient and what is modern. The LiDAR map is unique in the region and presents a portrait of the valley in 2015, where the centuries of changes to its surface are being be recorded and compared to older surveys in the area.

Teotihuacan Valley LiDAR Map over aerial photograph (© PPC, Informe Temporada 2018).

In 2017, a special team was appointed to work on surface exploration. The objective of the team has been to ground truth the Teotihuacan Valley, to search and verify each of the data sets recorded on the LiDAR map of 2015. The team has concentrated on walking surveys, taking samples of the materials visible on the surface and verify the accuracy of the LiDAR map, to distinguish between what may be ancient and modern elements. Establishing relationships with local communities has been essential to understand how the modern areas of occupation have formed.

The surface survey has two teams, one that works in the laboratory and one that works in the field.. First, members of the team analyze the LiDAR map to detect possible ancient features and  name them as potential elements in the laboratory. The potential elements include features such as depressions, mounds,  plazas, structures, or terraces. Second, members of the team are responsible for verifying the potential elements in the field, a survey method known as ground truthing. With the help of geographical positioning devices (GPS), the team go to the precisely marked geographic coordinates on the map to collect materials and samples on the surface and record the areas. The members of the team cross compare the material in the field with the map, to infer ancient vs. modern occupancy.

In this case, a specific area is delimited, collecting ceramic fragments, obsidian, clay figurines and polished stones such as metates and manos. Furthermore, a detailed record of the elements, on the present vegetation, the current land use, and the presence of other materials are taken carefully. Everything that is collected is labeled and taken to the laboratory, where it is cleaned, washed, and marked by specialists. Ceramics and lithics specialists analyze and prepare materials and samples for preservation.

Teotihuacan Valley: collecting cultural materials.

This type of work carried out in the Teotihuacan Valley would not be possible without the support of the local communities, they are the ones that give us permission to walk on their fields, agricultural lands, “ejidos” and other properties. Communication is vital, as we are all united in the effort to preserve and study cultural heritage and history. In addition to the permits, provided by the government, to carry out the research. Local communities and residents provide personal knowledge about their land; narrating stories about past and changes that have occurred recently, and/or the old names of some places (such as the different hills that surround the valley). Communicating with local communities and residents provided us with information beyond the digital maps alone. We thank the following communities and residents for their unconditional support of our research:

  • Atlatongo (Palomar)
  • Barrio de Purificación
  • Belén
  • Cozotlán
  • Cuautlazingo
  • El Saltito
  • Ixtlahuaca
  • Maquixco
  • Oxtotipac
  • San Agustín Actipac
  • San Antonio de las Palmas
  • San Francisco Mazapa
  • San Isidro
  • San Lorenzo Tlalmimilolpan
  • San Lucas Tepango
  • San Pedro Tepetitlán
  • San Sebastián Xolalpan
  • Santa María Palapa
  • Santiago Tolman
  • Santiago Tepetitlán
  • Tlachinolpa
  • Tlajinga
  • Xometla

Furthermore, we want to thank the municipalities (Acolman, San Martín de las Pirámides, Teotihuacan de Arista, and Otumba), “Reino Animal” Conservation Center, and the Texcoco Delegation of the Secretary of Environment of the State of Mexico. We thank you for the attention you have given, the collaborative effort in understanding the history of the area,  the permission to grant permits, and ongoing support for this research project.

Social media & sharing icons powered by UltimatelySocial